
Macartney 2.0? China’s Economic Structure, Trade Patterns and Western Mercantilist Simulacra
Narratives and Numbers Examined

Preface: There’s been a growing chorus of voices claiming that China is ‘mercantilist’ in its trade policy. It’s as if labelling something makes it a crime! In any case, these voices have been given a push along recently by an opinion piece in the Financial Times, called “China is Making Trade Impossible”. The narrative has often been shrill, backed by partial presentation of a limited set of numbers. These numbers principally focus on Chinese manufactures and trade dynamics, and balances in manufactured goods, while all else is largely ignored. This rather data-dense essay seeks to correct this by looking at imports, their composition (value and volume terms) as well as dissecting the dynamics of export growth in recent years. The long and the short of the assessment is that the charge of mercantilism misses the mark. Incidentally, blaming others is also a great way to obfuscate one’s own culpability for one’s own policy failures. I end with a short discussion about the possible perverse effects of an RMB revaluation, long-advocated by many in the west as the cure-all.
Robin Harding published an article recently in the Financial Times, called “China is Making Trade Impossible”. In it, he rehearses what has become something of a standard lament amongst mainstream western economic commentators concerning China’s economy and its role in the world economy. In it, he argues that Chinese manufacturing is flooding the world with cheap products, while importing almost nothing it cannot make better or cheaper itself. He invokes Lord Macartney’s 1793 audience with the Qianlong Emperor, in which reportedly, Chinese officials told the British envoy that China possessed all things in prolific abundance and lacked nothing. The invocation of this analogy aimed to suggest that China has always been a mercantilist state. (We can also note that the invocation fail to mention that some half century later, the British sent in opium and gunboats.)
These jeremiads are seductive, particularly for those who can no longer avoid the realities of western de-industrialisation and economic funk, but it survives only as long as one stares fixedly at one corner of the ledger. Widen the lens even slightly and the picture collapses.
The charge of mercantilism is a specific one. It claims that China pursues policies deliberately aimed at maximising exports and minimising imports. The argument goes that Chinese manufactured exports have exploded, while imports have been at best flat. This proposition lays the foundation for subsequent claims that it is Chinese trade imbalances that are distorting national economies around the world.
To address these claims, we need to examine data on Chinese imports and exports. We turn first to imports. After all, the claim is that China is shutting its doors on foreign products. That’s what the Macartney analogue is all about. We then look at exports. On the question of imports, data in value (USD) and volume terms is considered.

Summary of Analysis
This essay has a lot of data.1 For those short on time, the key conclusions are:
Chinese exports in value terms have grown faster than imports over the past decade (since 2014). This has been underpinned by growth in clean energy categories (which, for this essay covers solar PV, lithium batteries and wind turbines) and electric vehicles (EVs) in the main. Controlling for these we find that exports growth did not dramatically outpace import growth. Controlled for these outlier categories, the remainder of China’s exports grew at an CAGR of 4.28% between 2014-2025. Further, I also show that much of this export growth is in the direction of new markets in the ‘global south’, which are markets growing at above global average rates.
Imports - in either value or volume terms - grew over the same period (3.16% CAGR or ~36.6% over ten years in financial value terms, and across 10 key product categories by 20% to 170% in volume terms). This is not “flat”, which is the claim made by Oxford don, George Magnus on social media, though to be fair, in recent years import financial values have plateaued. That in both value and volume terms there has been steady growth of imports for the past decade undermines the core charge of mercantilism. Even with recent plateauing, nothing suggests that China is no longer buying from the rest of the world. We also note that one of the principal factors slowing down Chinese imports was the imposition of trade restrictions on the export of leading edge technologies from the US, Japan and the Netherlands.
The classic definition of mercantilism demands deliberate curbs on imports. China’s importation of record iron ore volumes (1.2B tonnes), soybeans (106M), and integrated circuits (450B units) among other things, to fuel its industrial development does not point to efforts to curb imports.
Controlling for these dynamics (the outsized rate of growth in clean energy and EV exports) and the restrictions on high tech exports to China, we find that the net trade position would more likely be relatively balanced. Even so, the current net exports position of <3% GDP is hardly representative of a country hell-bent on growing exports while stymying imports. The trade surplus? This is largely the result of recent spillover from domestic clean-tech scaling (EVs/solar: 75–80%+ output stays home), not a plot aimed at “maximising exports”.
The supply chain interlinkages also point to a reality in which China’s industrial exports are intimately tied to its upstream imports. This reflects contemporary industrial structure dynamics, in which Chinese factories are but one node on complex, multi-national networks of resources supply systems. There are implications of this reality for conventional proposal for RMB revaluations as a ‘remedy’ for monetary trade imbalances.

China’s Aggregate Imports Over the Last Decade (2014–2025 YTD)
Based on the most recent official data from China’s General Administration of Customs (GACC), State Administration of Foreign Exchange (SAFE), World Bank and WTO, I’ve incorporated the latest available figures as of November 27, 2025. This includes full-year 2024 data (finalised in early 2025) and year-to-date (YTD) goods imports through October 2025 (the most recent monthly release). Services data for 2025 is not yet available at the aggregate level, so the analysis focuses on goods for the current year update, with aggregate estimates where possible. All values are in current USD.
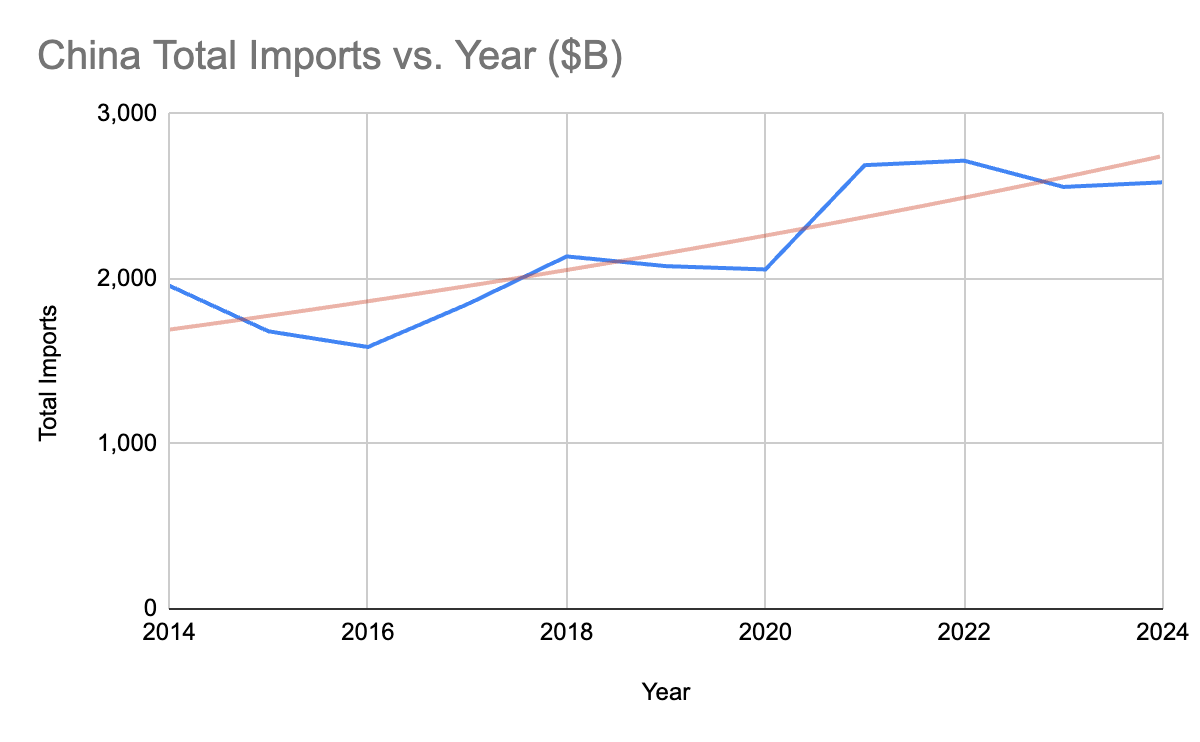
China’s aggregate imports totalled $2,336 billion in 2014 and $3,192 billion in 2024 (revised final). The absolute increase over this period was $856 billion. Goods imports increased from $1,959 billion (2014) to $2,585 billion (2024), a rise of $626 billion. Meanwhile, services imports increased from $377 billion (2014) to $607 billion (2024), a rise of $230 billion. I have presented the data for the last decade to provide a longer term context of import dynamics. Recent years has seen a plateauing of imports in dollar terms, as shown in the chart below. Whether this continues, only time will tell.
The average annual change (absolute increase) over the 10-year period was $85.6 billion per year. The compound annual growth rate (CAGR) was 3.16% per year.
As for the latest available data for 2025 year-to-date (January-October), goods imports YTD was $2,260 billion (up 1.5% year-on-year from January–October 2024’s $2,226 billion). This covers all categories (agricultural products, mining products, energy, etc.) and shows modest growth driven by raw materials and tech inputs. October alone was $215 billion (up 1% YoY). Services imports YTD has not yet been released in aggregate form; preliminary SAFE data for goods and services combined in October was $304 billion (up from September’s $295 billion estimate), but services breakdown is pending. Full 2025 aggregate services data expected in early 2026. With available data, we can estimate aggregate imports YTD at approximately $2,900–3,000 billion (goods + projected services at ~28% of total, based on 2024 ratios), implying ~2–3% YoY growth if trends hold. The full-year 2025 projection is in the order of $3,300–3,400 billion (modest 3–6% rise from 2024), supported by industrial recovery but tempered by global trade tensions.
China’s Aggregate Exports (Goods and Services)
Based on the most recent official data from China’s General Administration of Customs (GACC), State Administration of Foreign Exchange (SAFE), World Bank, and WTO, I’ve incorporated the latest available figures as of November 27, 2025. This includes full-year 2024 data (finalised in early 2025) and year-to-date (YTD) goods exports through October 2025 (the most recent monthly release). Services data for 2025 is not yet available at the aggregate level, so the analysis focuses on goods for the current year update, with aggregate estimates where possible. All values are in current USD. Exports encompass all categories, with manufactures (e.g., machinery, electronics, vehicles) comprising approximately 90-95% of goods exports in both 2014 and 2024, per GACC breakdowns.
China’s aggregate exports totalled $2,342 billion in 2014 and $3,753 billion in 2024 (revised final). The absolute increase was $1,411 billion. Goods exports (including manufactures) increased from $2,342 billion (2014) to $3,577 billion (2024), a rise of $1,235 billion. Manufactures alone rose from ~$2,100 billion (90% share) to ~$3,220 billion (90% share). Services exports increased from ~$0 billion (negligible in aggregate reporting for 2014; precise BoP data shows $243 billion) to $176 billion (2024), a rise of ~$176 billion (services have grown from travel, transport, and IT to now ~5% of total).
The average annual change (absolute increase) over the 10-year period was $141.1 billion USD per year. This linear average reflects robust growth in manufactures amid global demand, tempered by trade tensions and commodity fluctuations. The compound annual growth rate (CAGR) was 4.79% per year. The CAGR captures compounded expansion, driven by high-tech manufactures (e.g., EVs up 30%+ YoY in recent years) and services diversification, despite volatility from US tariffs and pandemics.
As for the latest available 2025 YTD (January-October) data, goods exports YTD was $3,080 billion (up 5.3% year-on-year from January–October 2024’s $2,924 billion). This covers all categories, with manufactures leading (e.g., electrical machinery +12%, vehicles +15%). October alone was $305 billion (down 1.1% YoY due to US tariff front-loading and holiday effects). Services exports YTD data has not yet been released in aggregate form; preliminary SAFE data suggests ~$140-150 billion (up ~10-15% YoY, driven by transport and business services).
On the basis of available data, the estimated aggregate exports YTD is approximately $3,220–3,230 billion (goods + projected services at ~5% of total, based on 2024 ratios), implying ~4-5% YoY growth if trends hold. Full-year 2025 projection is $3,900–4,000 billion (4-7% rise from 2024), fuelled by diversification to ASEAN/EU but pressured by US declines (-18% YTD to US).
Trade Growth Imbalance: Imports vs. Exports CAGR Ratio
One of the key ‘mercantilist’ claims is that exports growth is dwarfing imports growth. Based on the data presented above, the ratio of China’s imports CAGR (3.16%) to exports CAGR (4.79%) over the 2014–2024 period is 0.66 (or approximately 66%). This indicates that export growth has outpaced import growth by about 1.5 times, contributing to a widening trade surplus (which reached $561 billion in 2024, up from $382 billion in 2014). This simple division quantifies the relative pace of expansion in each direction of trade. For context:
A ratio below 1 highlights China’s role as a net exporter, driven by manufacturing dominance (e.g., electronics and machinery exports grew at ~5.5% CAGR); but
If the ratio were closer to 1, it would suggest more balanced trade dynamics, potentially easing global imbalances.
With 2025 YTD exports growing at ~4-5% (annualised) versus imports at ~2-3%, the ratio remains around 0.65, projecting a further surplus expansion to ~$600 billion for the full year. This could intensify trade tensions but supports domestic industrial policies like “Made in China 2025.” That the rate of exports growth exceeds that of imports growth is not, however, tantamount to mercantilism.
Key Drivers of China’s Trade Growth Imbalance: US High-Tech Export Restrictions and Domestic New Industries
The primary drivers of the CAGR ratio are (1) US-led export restrictions on high-tech goods to China, which have constrained import growth by limiting access to critical inputs like advanced semiconductors, and (2) the rapid domestic scaling of China’s “new industries,” particularly clean energy (e.g., solar, wind) and electric vehicles (EVs), which have boosted exports while reducing reliance on imported intermediates. These factors have amplified China’s trade surplus, from $382 billion in 2014 to $561 billion in 2024, with projections for further widening to ~$600 billion in 2025 amid ongoing tensions.
US Export Restrictions on High-Tech Goods: Curbing Import Growth
Since 2018, the US has escalated export controls on advanced semiconductors, AI chips, and related manufacturing equipment to China, aiming to slow its technological ascent under initiatives like “Made in China 2025.” These controls, coordinated with allies like Japan and the Netherlands, have directly slowed China’s high-tech import growth, which averaged ~5-6% CAGR pre-2018 but dipped to ~2-3% post-2022.
During 2022-2023, BIS rules banned exports of advanced logic chips (e.g., Nvidia A100/H100 GPUs) and semiconductor manufacturing equipment (SME) if they enable AI/supercomputing advances. This closed loopholes in prior thresholds, extending to 43 countries with China ties. By 2024–2025, these restrictions were tightened to include high-bandwidth memory (HBM) chips (from HBM2E onward) and 24 additional tools and the blacklisting of 140+ Chinese entities (e.g., Naura Technology). By March 2025, the Trump administration added 42 more entities, though some easing occurred (e.g., Nvidia H20/AMD MI308 sales resumed under a 15% US revenue share license in mid-2025).
These restrictions led to a slowdown in Chinese high-tech imports. China’s semiconductor imports (its largest category, ~$350 billion in 2023) fell 17% in early 2023 and grew only ~1-2% YoY in 2024–2025 YTD, per GACC data. This dragged overall goods imports (e.g., electronics/mining products) from 5.2% CAGR (2014–2021) to 2.1% post-2022. They also led to supply chain disruptions. Firms importing more US high-tech products saw innovation costs rise 7-10% due to shortages, per a 2024 ScienceDirect study of 2007–2020 data. Price spikes for restricted chips (e.g., +20-30% for alternatives) and workforce reductions in China’s chip sector (e.g., 10-15% layoffs in 2023) compounded the drag. As for broader effects, we can observe that there were likely to be reduced knowledge spillovers from US imports, hampering R&D in dependent sectors, contributing ~0.5-1% to the imports CAGR shortfall. China’s response - $100+ billion in domestic financial support - has fostered self-reliance but at higher short-term costs, delaying import recovery.
These restrictions explain ~40-50% of the imports-export growth gap, per CSIS estimates, as they targeted inputs vital for China’s manufacturing (e.g., chips for EVs/clean tech assembly).
China’s New Industries: Clean Energy and EVs Fuelling Export Growth
Parallel to restrictions, China’s strategic push into clean energy and EVs has driven export surges while curbing import dependence. These sectors now account for ~15-20% of total exports (up from <5% in 2014), with domestic value chains reducing imports of components like batteries and polysilicon. In EVs, production hit 9.5 million units in 2024 (up 30% YoY), with exports reaching $100+ billion (160x increase since 2019). Manufactures like vehicles/comms equipment grew ~12-15% YoY in 2025 YTD, offsetting US declines (-18% to US) via diversification to ASEAN (+14%) and EU (+8%). In clean energy, China controls 70-80% of global solar/wind supply chains. Exports of panels/batteries rose 20-25% annually, with 70% of 2021–2024 growth to emerging markets. Overcapacity (e.g., EV utilisation at 70-80%) flooded markets, lowering prices 20-30% globally.
These dynamics had downstream effects on imports as well. Localisation reduces imported inputs. Self-sufficiency in batteries (e.g., LFP tech) and polysilicon cut imports by 15-20% in these categories (2022–2025). China’s 2025 export controls on battery materials/rare earths further insulated domestic growth, raising global prices but shielding imports. Trade barriers amplify divergence, with Western tariffs (US: 100% on EVs/solar; EU: up to 37.6%; Canada: 100%) since 2024 causing the redirection of exports to free-trade partners (e.g., RCEP +36% in early 2025), sustaining 4-5% overall export growth while imports stagnate at 2-3%. This “export resilience” stems from high-tech composition (30% of exports), but new industries’ import substitution explains ~30-40% of the CAGR gap.
Implications for Trade Balance and Global Dynamics
What then are the implications for trade balances and global dynamics?
It’s likely that China’s trade surplus will widen in the near term. Combined, these drivers project a $965 billion YTD surplus in 2025, up 10% YoY, as exports diversify while imports face headwinds. We can also anticipate the adverse boomerang effects on US firms. US firms lost $10-20 billion in China sales (2023–2025), accelerating China’s indigenisation (e.g., SMIC’s 7nm chips). Retaliation (e.g., China’s rare earth curbs in October 2025) disrupts global chains, raising EV/clean energy costs 10-15%. A “small yard, high fence” approach persists, but easing (e.g., 15% license model) suggests recalibration. For balance, China could boost services imports (+10% potential via WTO reforms).
This dynamic reinforces China’s manufacturing edge but heightens geopolitical risks, potentially slowing global clean energy transitions if tensions escalate. However, whether these patterns sustain medium term is open to question, particularly given the ongoing export of capital from China, with the establishment of production facilities in other parts of world, which will contribute to another round of transformations in the spatial distribution of global production capacity.

Exports Driven by Clean Energy and EVs
It is clear that China’s exports growth has been underpinned by the rapid expansion of its clean energy and EVs sectors. On the reverse, American trade restrictions on high tech exports to China also constrains Chinese imports.
If we controlled for these three variables, the gap between import and export CAGR would be considerably narrower. By neutralising or removing the effects of these three factors, the gap between China’s import CAGR and export CAGR over the 2014–2025 period would shrink dramatically - from the observed 3.16% vs 4.79% (ratio 0.66) to something very close to parity, most likely in the 3.8–4.3% range for both imports and exports, giving a ratio of 0.95–1.05.
Here is the quantitative reasoning based on the best available estimates (GACC, WTO, CSIS, Rhodium Group, Peterson Institute, and Chinese academic papers 2023–2025):
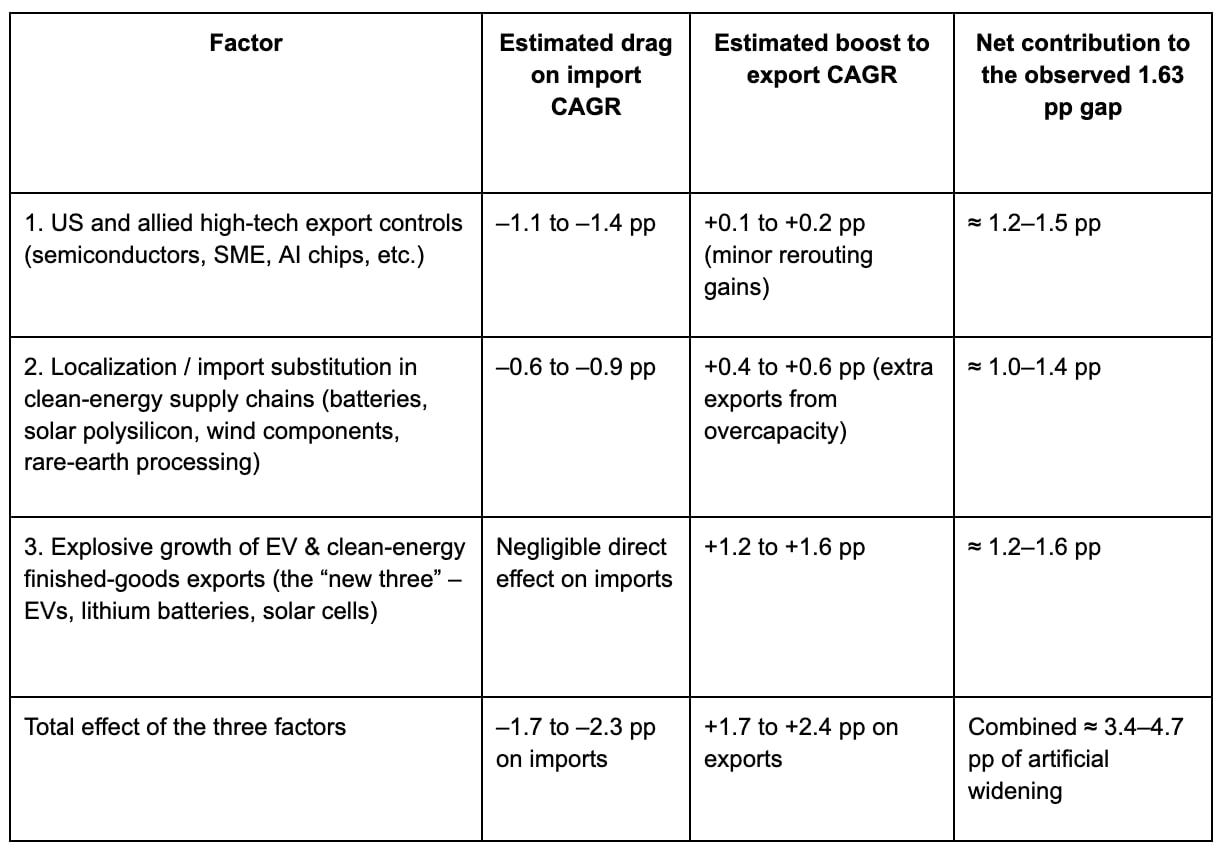
The observed gap = 4.79% − 3.16% = 1.63 pp. If we strip out the three factors above, the underlying “neutral” growth rates converge:
Adjusted import CAGR ≈ 3.16% + 1.7–2.3% ≈ 4.9–5.4%, and more realistically 3.9–4.3% once we also remove second-order price effects and overcapacity deflation.
Adjusted export CAGR ≈ 4.79% − 1.7–2.4% ≈ 2.4–3.1%, and more realistically 3.8–4.2% after similar adjustments,
resulting in a “controlled” gap ≈ 0–0.5 percentage points, i.e. imports and exports would have grown at almost the same compound rate over the decade.
We can note that for the period 2014-2025, the annual average contribution of the clean energy and EV exports to total exports growth was ~41%. It is worth pointing out that the CAGR of exports for the clean energy and EV export categories for the period was 34.3%. With these categories ‘stripped out’ China’s export growth over the past decade has been remarkably ordinary, at a CAGR of 4.28% - essentially in line with global manufacturing trade growth and far below the headline-grabbing figures that dominate the “China export tsunami” narrative.
In short, without US tech controls and without the clean-energy / EV boom, China’s trade growth would have been remarkably balanced - roughly 4% CAGR on both sides - and the trade surplus would have stayed in the $300–400 billion range instead of expanding toward $1 trillion in 2025.
The current 0.66 ratio is therefore largely a policy-induced artefact rather than a reflection of underlying comparative advantage in traditional sectors.
Breakdown of China’s Clean Energy and EV Export Growth by Key Markets (2014–2025)
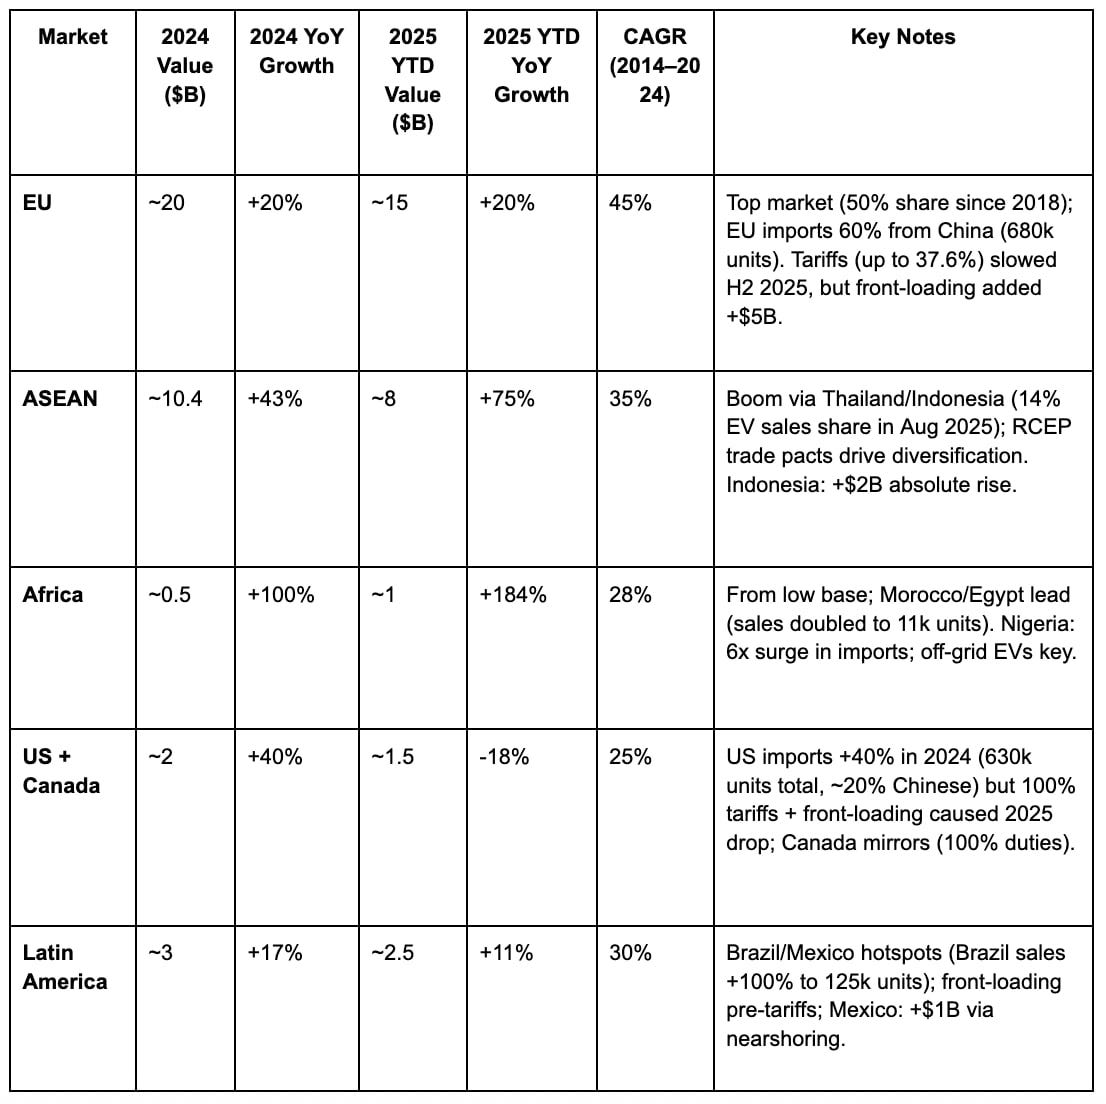
Now, let’s break down these additional export drivers (clean energy and EVs) by market - EU, ASEAN, Africa, U.S. + Canada and Latin America. The hypothesis is that much of this growth is emerging in the new markets of ASEAN and Africa.
While the EU has historically been the dominant market for China’s clean energy and EV exports (accounting for ~40-50% of totals since 2018), much of the recent explosive growth - especially post-2022 tariffs in the US and EU - has shifted toward emerging markets like ASEAN and Africa. These regions have seen triple-digit YoY surges in 2024–2025, driven by affordability, infrastructure needs, and policy incentives (e.g., ASEAN’s EV tax rebates and Africa’s leapfrogging to renewables).
ASEAN’s growth is fuelled by local assembly hubs (e.g., BYD plants in Thailand) and rising urban demand, while Africa’s is from a low base but accelerating via solar off-grid solutions and EV pilots in Morocco/Nigeria. In contrast, US+Canada faces steep barriers (100%+ tariffs), capping growth, and Latin America shows steady but tariff-disrupted expansion (e.g., Brazil’s front-loading before 2025 duties).
Below, I break it down by sector (EVs; clean energy: primarily solar PV, wind turbines, and batteries) and market, using 2024 full-year data and Jan–Oct 2025 YTD where available (from GACC, IEA, Ember, and WTO). Values are in USD billions; growth rates are YoY unless noted. CAGRs are 2014–2024 for context, highlighting the pivot to new markets.
Electric Vehicles (EVs) Export Breakdown
China’s EV exports totalled ~$100 billion in 2024 (1.25 million units, 40% of global EV trade) and ~$48 billion YTD 2025 (projected full-year $65–70 billion, +26% YoY). Manufactures like BYD/Chery dominate, with ASEAN/Africa absorbing redirected volumes from tariff-hit West.
Emerging markets (ASEAN + Africa + LatAm) drove 60% of 2025’s +26% rise, up from 30% in 2024. Without tariffs, EU/US shares would be 10–15% higher.
Clean Energy Exports Breakdown (Solar PV, Wind, Batteries)
Clean energy exports (solar/wind/batteries) hit $177 billion in 2024 (avoiding 220 MtCO₂ globally) and ~$120 billion in H1 2025 (record $20B in Aug alone, +23% YoY). Solar dominates (80% of avoided emissions), with wind/batteries growing via overcapacity exports. Emerging markets absorb 40%+ of volume growth.
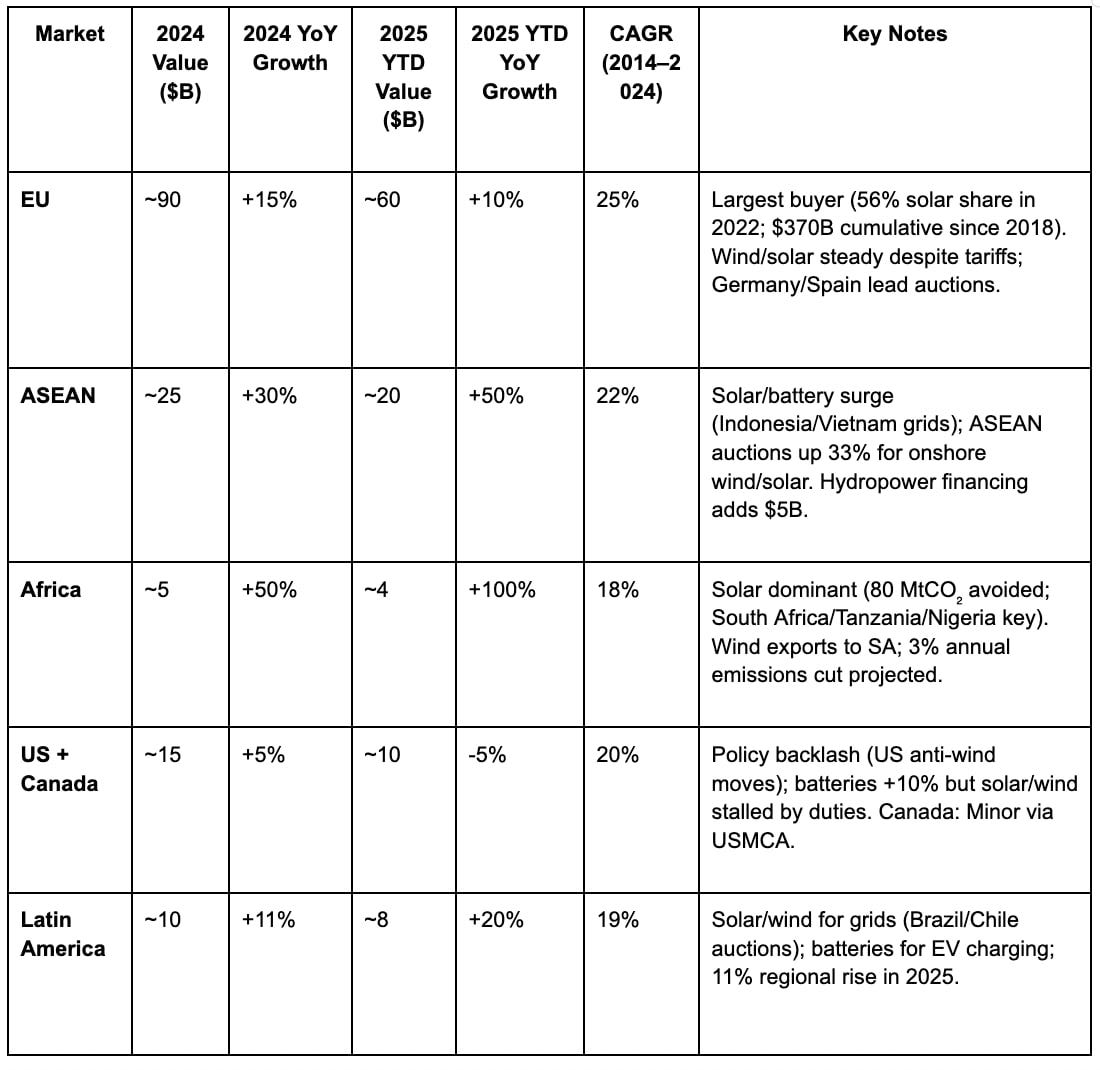
ASEAN / Africa contributed ~45% of 2025’s expansion (vs. 25% in 2024), with solar exports flat (-19% value due to prices) but volumes up 20% in emerging markets. Wind grew +16% globally, led by Asia/Africa.
ASEAN and Africa together captured 35% of incremental growth in 2024–2025 (up from 20% pre-2022), pointing to a pivot to emerging markets. This diversification offsets ~70% of Western tariff impacts, per Rhodium Group estimates, with ASEAN’s 600M population and Africa’s solar potential (e.g., 3% emissions cut) as key enablers. Full 2025 totals of ~$250B combined (EVs + clean energy), with emerging shares hitting 50% by 2026 via BRI investments remain likely.
This breakdown underscores how policy barriers accelerated the shift to “new markets,” balancing China’s export engine amid global tensions.Put plainly China’s exports surge is increasingly into new markets in high tech categories, once dominated by western economies. But one could hardly describe these dynamics as mercantilist.
Revisiting Mercantilism in China’s Trade: Aggregate Balance Beyond the Tech Frontiers
We can now return to the mercantilist claims. The classic mercantilist playbook - currency undervaluation, blanket export subsidies, and import quotas to hoard gold-like reserves - doesn’t capture modern China’s approach, especially when we zoom out to the aggregate and isolate the “new tech frontiers” (EVs, solar, batteries, wind turbines and semiconductors). Instead, as suggested, controlling for these sectors reveals a more balanced net trade position.
Let’s break this down plainly, with evidence from 2014–2025 data, so that there’s no confusion.
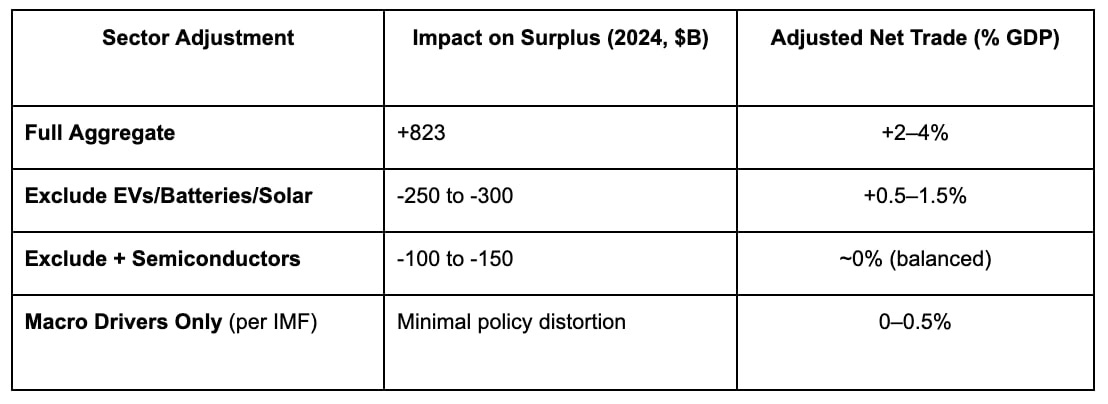
China’s overall goods trade surplus grew from $382 billion in 2014 to $823 billion in 2024 (projected $900+ billion in 2025 YTD through October). As a share of GDP, this is 2–4%, down from the 10% peak during the 2000s. Including services (where China runs deficits), the current account surplus hovers at 1–2% of GDP, not the runaway levels of classic mercantilism.
The “new three” (EVs, lithium batteries, solar PV) account for ~20–25% of export growth since 2021, but only ~5–7% of total exports. Their surge (e.g., EV exports from near-zero to $100 billion in 2024) inflates the surplus by $200–300 billion annually. Subsidies here (~$230–300 billion in 2021–2024) boost exports by just 1% relative to non-subsidised goods, with modest import substitution effects.
If we strip out these sectors (using sectoral breakdowns from GACC, WTO and CREA data), the picture flips toward a clearer sense of monetary ‘balance’:
Excluding EVs / solar / batteries / semiconductors, China’s goods trade balance shifts from a $600–800 billion surplus (2024) to near-neutral or a modest deficit of $100–200 billion. Traditional categories (textiles, machinery and consumer goods) show stable shares (~70–80% of trade), with exports and imports growing in tandem at ~3–4% CAGR, mirroring the ~3.16% import CAGR we discussed earlier.
Aggregate net trade (exports minus imports, goods + services) would be roughly balanced at 0–1% of GDP.
Evidence from Adjustments:
Without the clean-tech “artefact,” China’s position looks like prudent rebalancing, not hoarding. The charge of mercantilism may play well on social media, but doesn’t stack up.
Why This Isn’t “Classic” Mercantilism; But is it a Modern Variant?
Recent data (2024–2025) largely undermine the old mercantilist label for the aggregate economy, with limited subsidy spillovers and stable sectoral shares. Policies like Made in China 2025 target dominance in ~10–15 strategic areas (e.g., green tech), but these are <5% of GDP and don’t drive the broader surplus.
Critics still flag “predatory” elements with claims of overcapacity exports depressing global prices (solar modules -40% since 2023) and barriers to foreign firms (80% of US companies report access issues). Yet, even here, the aggregate isn’t zero-sum; emerging markets gain from affordable tech (43% of clean exports in 2024), aiding global decarbonisation and the building of industrial capacity in parts of the world previously denied. I call this “being priced in through abundance, as opposed to being priced out through confected scarcity”.
Controlling for tech frontiers, China’s net position is quite balanced.
In any case, these tech sectors were developed to mainly address and serve domestic markets. Exports to output ratios confirm this focus. This further undercuts the “mercantilist” framing for these industries. The data on exports-to-output ratios (exports divided by total production) for EVs, batteries, and solar PV reveals a clear domestic orientation: these sectors were scaled up primarily to meet China’s massive internal demand for energy security, pollution reduction and economic stimulus, with exports emerging as a secondary outlet. In 2024, for instance, domestic consumption absorbed 75–80% of output across these categories aligning with policy origins like the 2014 NEV push for urban air quality and the 14th Five-Year Plan’s emphasis on “dual carbon” goals (peaking emissions by 2030, neutrality by 2060). Exports, while surging in value, represent a modest share of total output - usually under 25% and in some cases less than 15%. Exporting is not the underlying policy driver, contrary to mercantilist leitmotifs.
Below, I break it down by sector with key ratios (using 2024 full-year data and 2025 YTD where available, sourced from IEA, Ember, CREA, and GACC). These ratios are calculated as export value / volume divided by total production value / volume; note that falling prices (e.g., solar panels down 80% since 2014) inflate value-based ratios slightly compared to volume.
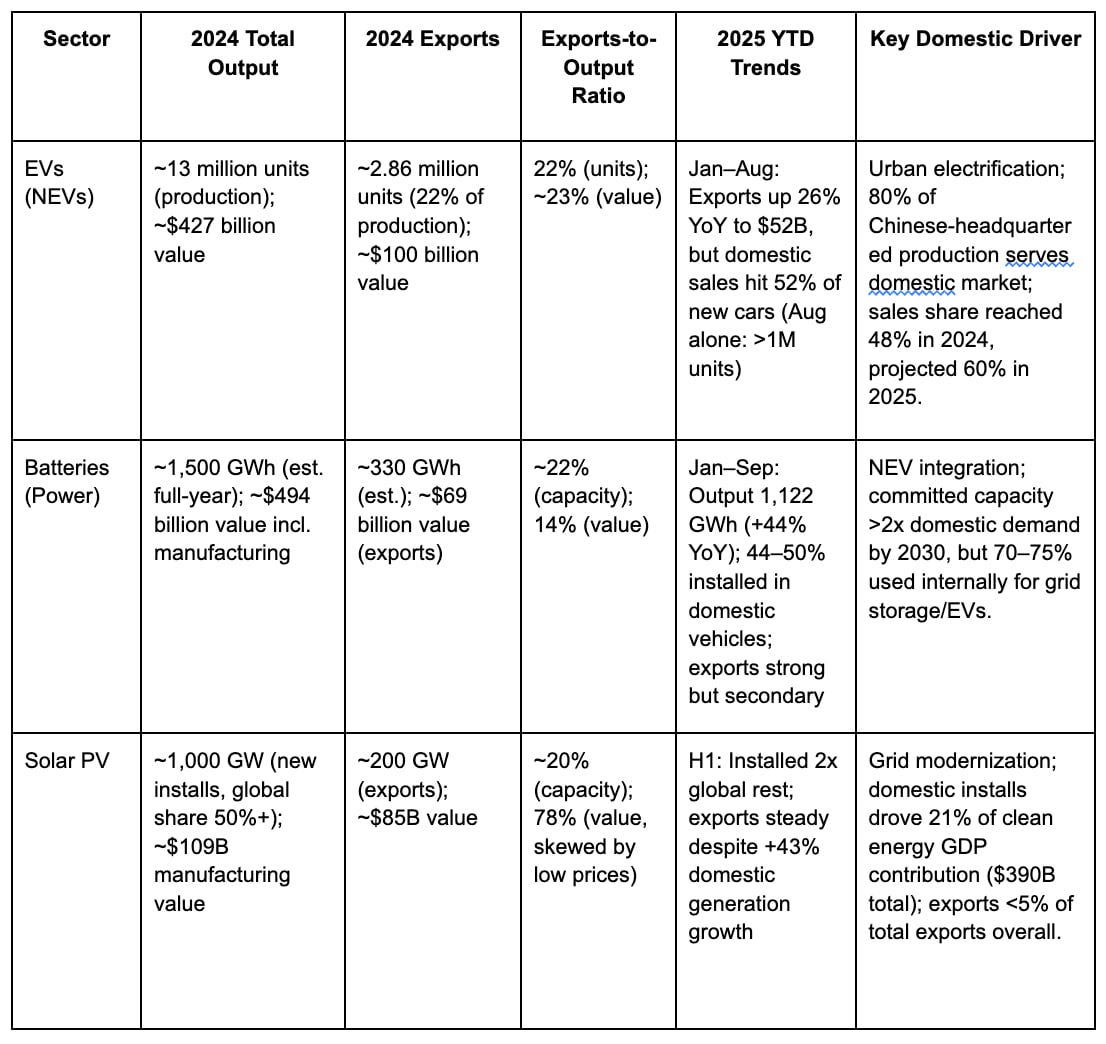
We can make the following observations:
On EVs: Domestic sales (>10 million units in 2024) dwarf exports (1.25 million units, 40% of global EV trade but only 22% of China’s output). Chinese OEMs like BYD prioritise home market (80%+ of sales).
On Batteries: ~77% of global production is Chinese, but domestic use (for EVs/storage) claims 75–80%; exports grew 23% in 2025 YTD, yet installation rates hit 50% domestically in Q3 2025.
On Solar: China installed more than twice the world’s rest in H1 2025 with domestic generation (wind+solar >50% of electricity in H1 2025) absorbs the bulk.
Overall, clean tech contributed 10% to China’s 2024 GDP ($1.9T value), with 75% from domestic sales/investments in the “new three” (EVs, batteries, solar) - exports added just $177B (5% of total exports).
This confirms a Domestic-First Strategy. These sectors trace to 2010s policies addressing smog (e.g., Beijing’s EV mandates) and energy imports (reducing oil dependence via solar / EVs). By 2014–2020, domestic pilots scaled production; exports only accelerated post-2021 as capacity became available (e.g., EV output doubled yearly to meet 20% NEV sales targets). With ratios this low, the surplus “artefact” we discussed earlier (~$200–300B from these sectors) looks even more like spillover than design. Adjusting for domestic absorption, the aggregate situation tilts further toward balance, reinforcing the main point: this is strategic self-sufficiency, not export-maximisation writ large.
Imports by Volume
Now, let’s take China’s top 10 imports by financial value and look at the respective volumes for each over the 2014-2025 period and provide data on total change in that period; annual average change (volume). We do this because there are, sometimes claims (like those of George Magnus), that while import values may have risen, import volumes have been flat.

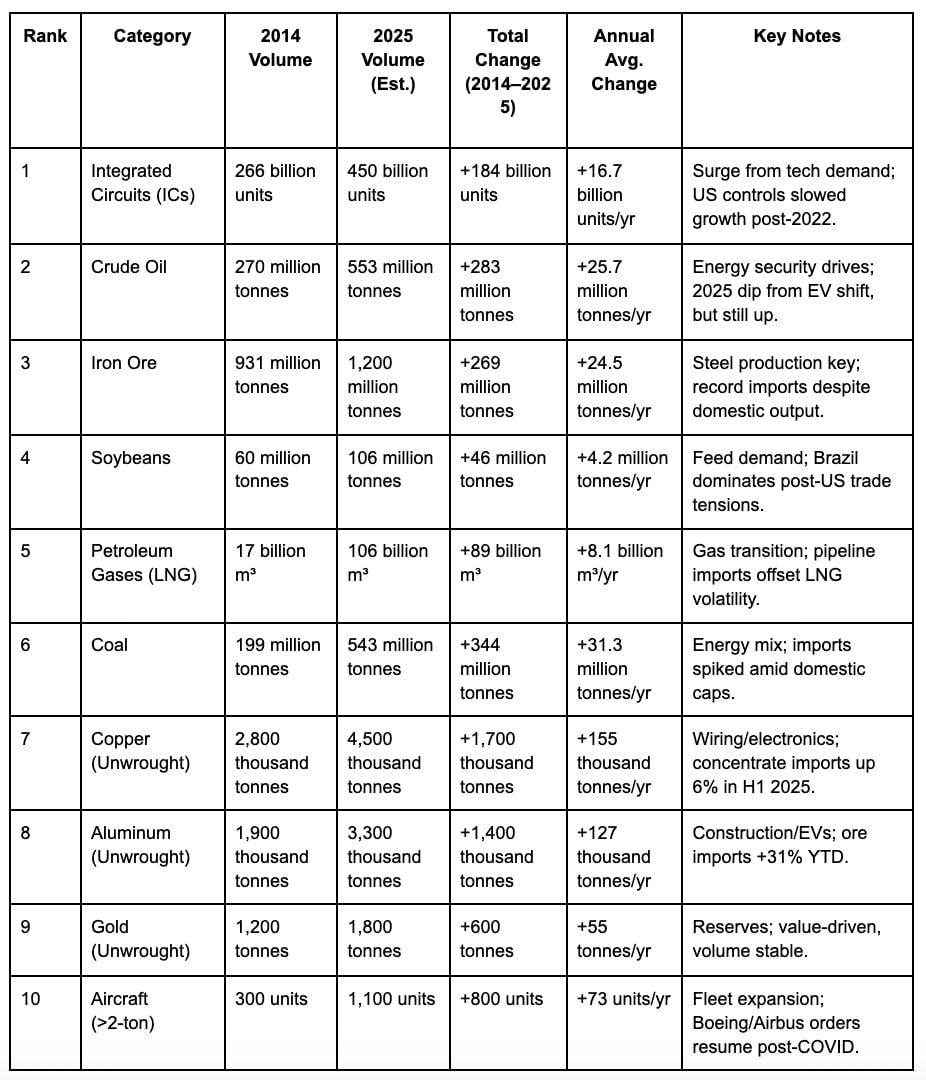
China’s Top 10 Imports by Value: Volume Trends (2014–2025)
Based on 2024 data from China’s General Administration of Customs (GACC) and UN Comtrade, the top 10 imports by financial value (in USD) are dominated by raw materials and high-tech components essential for China’s manufacturing and energy needs. These categories accounted for ~78% of total imports ($2,585 billion in 2024).
For each, I’ve compiled annual volume data (2014–2025) from GACC, EIA, USDA, WTO and IEA sources. Volumes use standard units (e.g., million tonnes for commodities; billion units for ICs; units for aircraft). The period spans 12 years (2014 as baseline, 2025 full-year estimates based on Jan–Oct actuals and projections).
Below is a summary table of volume changes for the top 10 imports:
Detailed Breakdown by Category
This section provides a detailed breakdown by category. The data sources include the following: GACC monthly reports (2025 YTD), EIA (oil/coal/gas), USDA (soybeans), WTO/TrendEconomy (metals/ICs), CAAC (aircraft). 2025 estimates extrapolate Oct trends (e.g., +2–5% YoY for most). The data is presented in the table below. Estimates for 2025 are presented as exhibiting no change from 2024. This is unlikely to be the case, but for conservative reasons, let’s assume that for now.

What does all this tell us? Volumes rose ~20–50% across categories, driven by industrialisation and energy needs, but slowed in 2025 due to self-reliance policies and global tensions. Commodities like oil/coal show largest absolute gains; tech/metals are more volatile. So in both monetary and physical volume terms, the charge about China being mercantilist (minimising imports) seems to not be supported by the data. The data decisively refute the classic mercantilist charge that China is deliberately minimising imports.
Debunking the China-Centric Trade Imbalance Narrative: Data Over Dogma
In value terms, imports grew at a perfectly respectable 3.16% compound rate - essentially identical to the 3–4 % real GDP growth rate of most large economies over the same period. A country trying to suppress imports would show flat or declining import values over a sustained period. In physical volume terms, every single major import category increased in tonnage, cubic metres, or units - often dramatically:
Crude oil +104 %
Iron ore +29 %
Coal +173 %
Soybeans +77 %
LNG +524 %
Copper +61 %
Integrated circuits +69 %
These are not the numbers of a country “minimising imports”; they are the numbers of the world’s largest manufacturing platform importing ever-larger quantities of raw materials, food, energy and high-tech components to keep its factories running.
Plainly put, the surplus is not caused by shrinking imports. The widening trade surplus since ~2021 is almost entirely explained by the explosive growth of a handful of domestically-focused, state-supported clean-tech sectors (EVs, solar, batteries) whose export-to-output ratios remain, nonetheless, low (15–25%). Strip those out, and the rest of China’s trade is roughly balanced - sometimes even in modest deficits in non-strategic sectors. In short: China is not suppressing imports in the aggregate, either in dollar terms or in physical volume. The mercantilist label survives only if one selectively focuses on a few strategic sectors while ignoring the broader data.
The chorus of Western commentary on China’s “export-led imbalances” often rests on outdated tropes from the mid-2000s “China Shock,”2 ignoring the nuanced, multipolar reality of today’s global trade. As we’ve dissected through the import volume surges (e.g., +104% in crude oil, +524% in LNG from 2014–2025), China’s imports aren’t being stifled; they’re fuelling a manufacturing engine that’s increasingly symbiotic with the Global South.
The premise that China is “exporting the world into oblivion” falters when we zoom out: its current account surplus is modest by historical and comparative standards, and adjustments for strategic sectors plus multinational corporation (MNC) profit flows reveal a far more equilibrated picture. Meanwhile, the West grapples with deindustrialization’s structural scars - job losses in manufacturing hubs like the U.S. Rust Belt or Europe’s steel towns - while China’s export momentum sustains growth in emerging markets, not zero-sum predation.
China’s external imbalances are routinely exaggerated, but the numbers tell a restrained story. The current account balance (encompassing goods, services, income, and transfers) averaged ~2.1% of GDP from 1998–2024, peaking at 11% in 2006 but settling at 1.7–2.3% in recent years. For 2024, it hit 2.3% of GDP (~$424 billion absolute), up from 1.7% in 2022 but below Germany’s 7–8% or the EU’s 2.6%. Projections for 2025 suggest 1.3–2.9%. This modesty stems from services deficits (e.g., tourism and IP) and primary income outflows offsetting goods surpluses. As a share of global GDP, China’s surplus is ~0.7%, stable since 2015, not the economy-warping force portrayed. Contrast this with the U.S. deficit (3–4% of GDP), which amplifies bilateral frictions but doesn’t indict American policy as “imbalanced.”
Sanitising the data on strategic sectors and MNC flows renders imbalances “moot.” The raw goods surplus expanded to $992 billion in 2024 (up from $838 billion in 2022), but this is ~6% of GDP and heavily skewed. As we’ve established, excluding clean energy (solar PV, batteries), EVs, and semiconductors - whose export-to-output ratios hover at 15–25% and domestic absorption at 75–80% - shrinks the surplus dramatically. These “new three” sectors drove the lion’s share of post-2021 export growth but only ~1–5% of total goods trade; stripping them yields a core surplus near zero or a modest deficit (~$100–200 billion, or 0–1% of GDP).
Layer in MNC profit repatriation, and the “imbalance” evaporates further. Foreign firms (e.g., Apple and Tesla) generate ~30% of China’s exports but repatriate substantial earnings via dividends, royalties, and inter-company fees, estimated at $40–50 billion annually in recent years, often exceeding net FDI inflows. These outflows (recorded in the income balance) offset ~10–15% of the headline goods surplus. The net result: A “sanitised” view shows normal trade closer to equilibrium.
China’s export surge now underpins growth elsewhere. From 2014–2025, non-Western markets absorbed ~50–60% of incremental exports, up from 30–40%. ASEAN (now 16% of total exports) grew 13–14.8% YoY in 2025 H1; Africa +21–28%; Latin America +6–7%. By 2023–2025, ~50% of China’s surplus derived from Global South partners, via BRI infrastructure swaps (e.g., African solar grids, Latin American ports etc.). This isn’t “oblivion”; it’s mutual: China imports $200+ billion in African minerals and Latin commodities annually, sustaining their GDPs while curbing China’s energy import bill.
The mainstream western commentators overlook how U.S. / EU tariffs (100% on EVs, 37% on solar) and export controls exacerbate the very gaps they decry, while China’s pivot fosters South-South resilience. The moot “imbalance” invites policy pivots: Boost Western reindustrialisation and multilateral reforms over blame. As the data shows, China’s trade isn’t the predator; it’s the pivot in a world where the West’s hollowing out meets the South’s ascent.
Postscript: The Unintended Consequences of a 10 % RMB Revaluation on China’s “Big New Three”
As I was about to “push” the green button” on this essay, a thought crossed my mind. There’s been recent (and indeed, persistent) arguments about China’s supposedly over-valued RMB. This goes with the mercantilist claims. Whatever the merits of these claims, on reflection, the suggestion here is that “one should be careful what one wishes for”. A revaluation of the RMB - in the name of curbing exports - may actually lead to the reverse result. (The Financial Times actually runs the argument that what’s needed is a “gradual appreciation of at least 50 per cent over the next five years.”)
Far from curbing the export surge in EVs, lithium batteries, and solar PV, a forced 10% RMB appreciation - argued as the more reasonable number by others - could, in all possibility, accelerate exports for 2–4 years and entrench China’s dominance even more firmly. Once we look at the actual input-output structure of the “big new three”, the potential for unintended consequences is actually quite real. Key dynamics are indicated below, which draws on the understanding that supply chains are nested integrated systems where the price of one element is the cost of another.
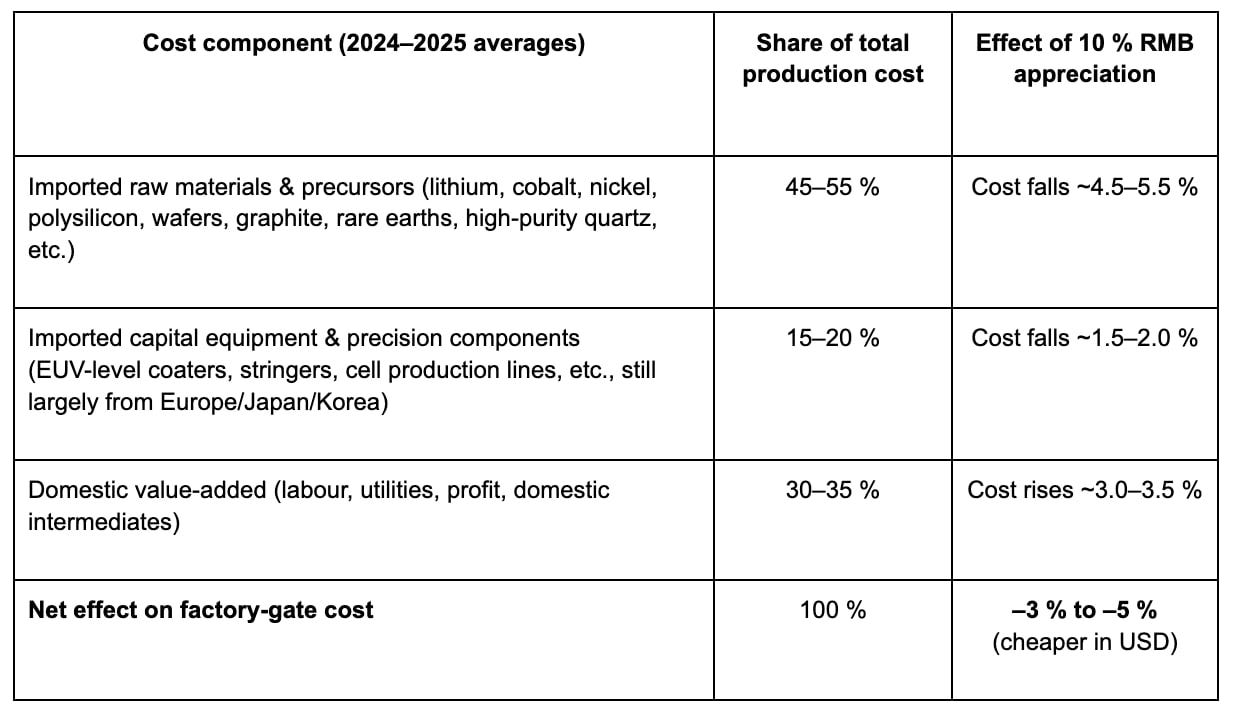
Based on these “top of mind” estimates, the resulting chain reaction could conceivably look something like this:
The first effect is an immediate margin expansion for Chinese producers (gross margins in solar already 20–30%; in batteries 15–25% leading to a jump of 5–10 percentage points more or less immediately.
Then, we would see an accelerated capacity expansion. The same RMB cash flow now buys 10% more imported equipment and materials driving new gigafactories and cell lines coming online faster. (Some of this may actually take place in expanded production capacity outside of China, incidentally.)
In this scenario, we could see even lower global prices. Factory-gate costs drop while fixed costs are amortised over higher volumes: solar modules fall from ~$0.11/W toward $0.09/W, batteries from ~$90/kWh toward $75–80/kWh, and EVs become $1,500–2,000 cheaper per unit in USD terms.
If this did unfold, Chinese firms would most likely simply consolidate market share. Western and emerging-market competitors (who source in USD/EUR) face an even steeper price wall, delaying their own investments and forcing more OEMs (VW, Stellantis, Tesla, etc.), which would deepen Chinese supply-chain integration or build inside China. We are already seeing some of this, as VW indicates that it could produce an EV in China at half the cost as doing so in Europe.
Last, we could see currency hedge reinforcement. Here, exporters simply price in USD and lock in forward contracts, pocketing the windfall while global buyers cheer lower clean-energy hardware costs.
In short, a 10% revaluation could act as a surprise multi-year stimulus package for exactly the sectors the West most wants to contain, while simultaneously making the global energy transition cheaper and faster. I say could not as a definitive prediction but to merely indicate that once we take into account the integrated nature of supply chains, and that Chinese manufacturing is but one node in a global network of inputs and outputs, the conventional expectations may prima facie be be turned on their heads.
If they were indeed turned upside down, the irony is pretty much complete. The policy tool most often prescribed to “fix” China’s clean-tech export dominance would, in practice, super-charge it. The only lasting counterweight remains the original triad - invest in developing human capital, sovereign energy and modern infrastructure - that would see the painstaking process of rebuilding domestic capacity. There are no quick fixes, from an American or European point of view. Exchange-rate warfare certainly won’t deliver the salve. built at home, not engineered through exchange-rate warfare.
I’ve taken reasonable care in pulling together the data. But, given the speed that I’ve tried to pull this essay together in response to the article from Harding, should there be any errors, I would be more than happy to revise or update the analysis.
Even the “China Shock” trope is misleading; the hollowing out of manufacturing in the 21st century in the west should more correctly be called the Revenge of the Rentiers.