


This is a ‘longish’ piece, which explores and discusses in some detail issues related to Donald Trump’s recent threats of 100% tariffs against BRICS nations. The article takes seriously the threat and aims to explore the implications should the threats become real. In light of the recent tariffs levied in Canadian, Mexican and Chinese products, it behoves us all to take seriously the tariffs threat. A Chinese version of this essay is here.
If change is the only constant, then the challenge in life is to work with the forces of change, to adapt purposefully and - in short - to strive to become more like water (Shang Shan Ruo Shui 上善若水). This is the lesson of the Book of Dao (Dao De Jing).

And if that is the nature of the world, so too is it in the affairs of global and national economic life. An economic system is one that is characterised by the flow of value as it transforms and assumes new forms. The issue is one of flow, impediments to it and how to respond in the face of blockages.
In a social media post on January 30, 2025, US President Donald Trump threatened 100% tariffs on BRICs countries unless they committed to “neither create a new BRICS Currency, nor back any other Currency to replace the mighty US Dollar”, and if they did not they “should expect to say goodbye to selling into the wonderful US economy”.
This is neither speaking softly nor, in fact, yielding a big stick. Trump speaks loudly but the stick isn’t as big as it once might have been.
Indeed, rather than act to preserve US dollar primacy, moves to impose tariffs on BRICS could potentially - indeed, in all likelihood will - hasten the expansion of currency multipolarity with adverse effects on the American political economy and living standards. The diminution of the dollar’s status will also be hastened. On this score, while any changes to key system parameters are by nature disruptive, the issue isn’t whether change is implied (that’s a given), but what the likely trajectory of the changes are and their likely impacts on different stakeholders and ultimately, on the system at large. How well can actors adapt in the face of intensified flux?

State of Play
Overall Trade Patterns
Today, the US comprises approximately 15% of global trade, and about 16.5% of China’s trade. This has been declining, as world trade continues to expand, having been about 20% of global trade in 2018. In relative terms, the U.S. isn’t as important today as it once was, a point recognised in a recent article in the Financial Times. Threats of losing access to the U.S. market simply don’t have the same national or system-wide effects as they once would have had; and most nations will to varying extents be able to weather whatever tariff tempest is unleashed within a reasonable period of time. This is something considered below.
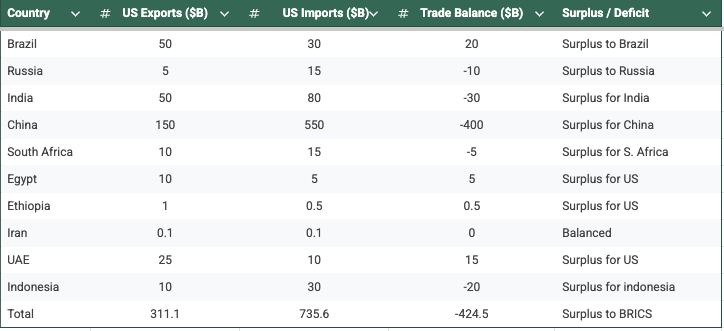
Trade between the full BRICS members (Brazil, Russia, India, China, South Africa, Egypt, Ethiopia, Iran, United Arab Emirates, and Indonesia - Saudi Arabia’s status has remained somewhat vague so for this analysis they have been excluded) and the U.S. for 2022-23 is estimated to have been ~US$1.05 trillion, with the U.S. running a $424.5 billion trade deficit (see Table 1). Of BRICS’ exports to the U.S., exports from China account for about 73%. Of BRICS’ aggregate surplus vis-a-vis the U.S., some 84% is due to China’s trade surplus. Trade between the U.S. and Russia and Iran are already negligible, due to existing sanctions. Put simply, the issue with BRICS’ trade with the U.S. is largely a U.S.-China question, which means that most other BRICS nations are unlikely to be particularly perturbed by threats of tariffs, though the question remains the extent to which they can adjust to any loss of US markets.
Table 1: Summary of Trade Balances: US and BRICS Nations (2022-2023)
National Details
It is worth summarising the composition of trade between individual BRICS member states and the U.S. This will provide a foundation for subsequent consideration of potential adjustments and the impediments to adjustments in the face of tariffs. The key features to note are:
Brazil’s principal imports from the U.S. comprise machinery, aircraft, chemicals and agricultural products. Its exports to the U.S. comprise oil, iron ore, soybeans and aircraft parts.
Russia’s principal imports from the U.S. comprise machinery, medical equipment and agricultural products. Conversely its exports to the U.S. comprise oil, metals and fertilisers. Trade between Russia and the U.S. has contracted substantially since the beginning of 2022.
India’s imports from the U.S. comprise aircraft, machinery, pharmaceuticals and agricultural products. Its exports to the U.S. comprise textiles, pharmaceuticals, gems and IT services.
China’s imports from the U.S. comprise aircraft, machinery, agricultural products and semiconductors. Its exports to the U.S. comprise electronics, machinery, textiles and furniture.
South Africa’s imports from the U.S. comprise machinery, vehicles and aircraft. Its exports to the U.S. comprise platinum, gold, vehicles and iron ore.
Egypt’s imports from the U.S. comprise wheat, machinery and aircraft. Its exports to the U.S. comprise textiles, petroleum products and fertilisers.
Ethiopia’s imports from the U.S. comprise machinery, aircraft and agricultural products. Its exports to the U.S. include coffee, textiles and leather goods.
Iran’s imports from the U.S. comprise medical supplies and humanitarian goods. It exports carpets, nuts and fruits to the U.S. Bilateral trade has been severely restricted due to U.S. imposed sanctions.
The UAE imports aircraft, machinery and vehicles from the U.S. It exports oil, aluminium and precious metals.
Indonesia’s imports from the U.S. comprise machinery, aircraft and agricultural products. Its exports to the U.S. include textiles, palm oil and electronics.
To summarise by product categories, BRICS nations import from the U.S. the following:
Machinery and Electronics: ~$200 billion (e.g., semiconductors, aircraft, medical devices);
Chemicals and Pharmaceuticals: ~$100 billion;
Agricultural Products: ~$50 billion (e.g., soybeans, corn, meat); and
Energy Products: ~$30 billion (e.g., LNG, coal).
Semiconductors and aircraft are the standout categories, and with growing sanctions in place on the former, it’s likely that imports of them from the U.S. will diminish over the next few years. The security classifications governing semiconductor exports from the U.S. issued under the Biden administration in its dying days effectively limits exports to all but a small number of so-called western allies. As for aircraft, Boeing has been the beacon for U.S. civilian exports in this category but the longstanding global duopoly between it and Airbus looks like coming under challenge from China’s own civilian aircraft capabilities.
Conversely, by way of summary, BRICS exports to the U.S. by product category mainly comprises the following:
Machinery and Electronics: ~$400 billion (e.g., smartphones, computers, consumer electronics from China);
Textiles and Apparel: ~$100 billion (e.g., clothing, footwear from China and India);
Metals and Minerals: ~$80 billion (e.g., steel, aluminum, rare earths from China and Brazil);
Energy Products: ~$50 billion (e.g., oil from Brazil and Russia); and
Pharmaceuticals and Chemicals: ~$50 billion (e.g., generic drugs from India).
In terms of manufactures, China is now the world’s only industrial super power. Chinese manufacturing contributes ~29% of global value added, and is growing. The U.S. contributes 12% of global value added. Analysis by Richard Baldwin indicates that the U.S. is considerably more dependent on Chinese manufactures than the other way, particularly in areas of fixed capital equipment, industrial machinery, and a range of raw materials necessary for industrial production. A raft of end consumer products are also imported with few alternative global supply chains. This has important implications for U.S. adjustment dynamics and possibilities, which are discussed in more detail below.

Complementarity of Trade Amongst BRICS
But let’s return first to the situation with BRICS nations. If tariffs are imposed impacting BRICS trade with the U.S., one part of the capacity to adapt will be conditioned by the extent to which BRICS nations as a network are internally complementary. The more complementary they are, the more likely they can act as substitutes for the U.S. market.
It is reasonable to say that on the whole, BRICS nations have complementary economies. For example, Brazil and Russia export commodities, while China and India are major importers of raw materials and exporters of manufactured goods. Similarly, the African continent has vast natural resources, including in BRICS member countries of South Africa, Egypt and Ethiopia, while countries like China and India are major consumers of these resources. Similarly, the UAE adds energy resources to the mix, which are in strong demand by other BRICS nations.
The burgeoning trade relations between ASEAN and China is another dimension of complementary, as evidenced by the fact that China-ASEAN trade now surpasses that between China and the EU. Indeed, intra-BRICS trade has been growing strongly. As of 2023, the total trade volume among BRICS nations is estimated to be in the order of $800-900 billion. This represents a 6-fold increase from the situation in 2010. Unsurprisingly, China is the largest trading partner with BRICS, accounting for ~60% of intra-BRICS trade. The BRICS members have relatively complementary economic structures and attributes, with development pathways reasonably well-aligned to enable trade amongst them to continue growing strongly.
Interestingly, these complementary relationships reduce the need for a third-party currency (like the USD) since trade can be settled directly in national currencies or through a shared unit of account.
Scenario Evaluation
Let’s assume that Trump does proceed with imposing 100% tariffs on all BRICS exports to the US. Assume too that BRICS nations will retaliate, with the result being a 90%+ reduction in trade volumes between these nations. In other words, Trump’s tariffs plan will put an end, for all intents and purposes, to trade between BRICS and the US.
What are the potential flow-on implications and effects?
BRICS Impacts and Adjustments
Firstly, BRICS nations will need to adjust to the loss of the U.S. market. This is Trump’s ostensible ‘big stick’. The potential for market substitution and for general global growth to absorb loss of U.S. markets will vary from country to country. That said, it is likely that for the most part, all BRICS nations will fully adjust within 3 years. My estimates are presented below, and aim not to provide a definitive crystal ball view on the future but to lay out probabilities and relevant parameters.
With the loss of the U.S. market, BRICS nations’ firms will need to find and develop alternative markets. The extent to which they can succeed, and the duration that is likely to be required, is impacted by the extent to which (1) these firms are already expanding their trade, (2) they are exposed to the U.S. market (exports to the U.S. as a share of total exports), and (3) the composition of products that are traded (i.e., the complementariness and availability of substitutes).
Table 2 below summarises the analysis. The analysis isn’t meant to be a definitive crystal ball, but to provide insights into parameters, possibilities and probabilities. It shows for each of the BRICS member states the extent to which they are reliant on the U.S. market for exports in terms of percentage of exports that go to the U.S. market. India (18%), China (17%) and Brazil (15%) are the most exposed, while the remainder have exposures of less than 10%. The table also shows the Annual Average Growth Rate (AAGR) for each member nation’s trade over the past 10 years (2013-2022). By analyzing historical export growth rates and projecting organic growth, I estimate that BRICS nations could absorb the loss of U.S. markets within 4 years, depending on their current trade diversification, reliance on the U.S. market and overall trade growth rates. Countries with high growth rates (e.g., Ethiopia, UAE) and low reliance on the U.S. (e.g., Russia, Iran) would adjust the fastest, while those with higher reliance (e.g., China, India) would take longer.
With the loss of the U.S. market, BRICS nations would likely pivot to other markets, particularly within the Global South and among themselves.
China already has diversified exports to ASEAN, Africa and the Middle East. Indeed, China’s trade growth rate with the global south has over the past decade or so exceeded that with the traditional advanced economies. In 2024, China’s trade with the global south exceeded its trade with the advanced economies for the first time ever. Brazil has been a beneficiary too, and has also boosted trade in Latin America. The launch of the Chancay port in Chile late 2024 can be expected to enable greater trade between Latin America and Asia. India has been increasing trade with Russia, the EU, Middle East and Africa. Russia has already transformed its trading networks, having been confronted with the most expansive array of western sanctions against any single country. The Russian experience shows what’s possible, and in a short timeframe, when necessity dictates. Intra-African trade can also be expected to grow, to the benefit of BRICS members like South Africa, Egypt and Ethiopia.
Additionally, proactive measures, such as trade agreements, fiscal stimulus, and regional integration could significantly shorten adjustment periods by hastening existing trends. Domestic fiscal stimulus could mobilise national demand to compensate for loss of U.S. demand though it should be noted that BRICS nations are actually not excessively dependent on trade for economic growth. Such measures could hasten full adjustment to the loss of U.S. markets and see a full recovery within 2.5 years for China, the largest exporter to the U.S. of all BRICS nations.
Table 2: Export Reliance on US and Estimated Adjustment Period - Global Growth
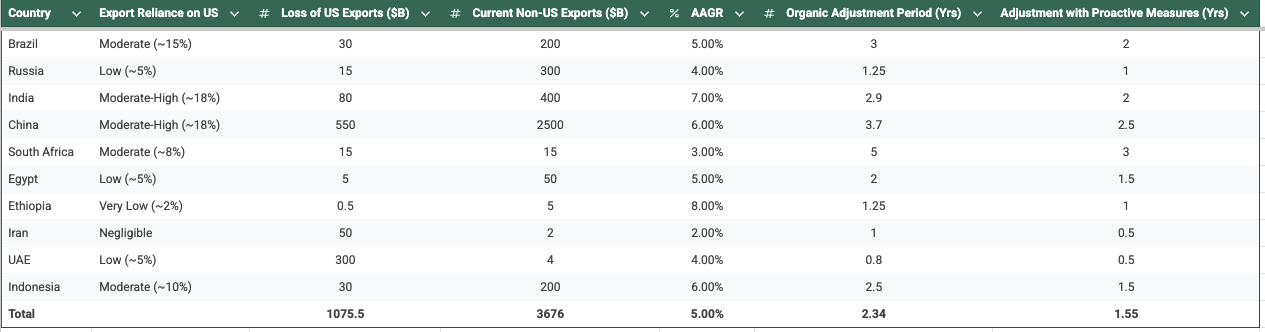
Table 3 summarises the likely adjustment strategies for each of the BRICS member states. These are presented at a high level, and are done so to suggest the availability of concrete responses.
Table 3: BRICS Nations - Exports to the US and Adjustment Strategies Summary

This analysis underscores the resilience and adaptability of BRICS nations, particularly when supported by strategic policies and investments.
If Trump’s aim of the BRICS tariffs is to build a bulwark against dedollarisation, the move runs the risk of backfiring. In this context, recall that BRICS’ full members represent around 55% of the world’s population and 45% of global GDP (in nominal terms). For a group of economies and populations of such scale to effectively be compelled to decouple from trading with the US will have substantial implications for the US dollar hegemony.

Currency Multipolarity Evolution
The global economic system has been slowly evolving in a direction away from dollar-dominance. I have called this currency multipolarity. This section will not review the precise nature and trajectory of evolution but will simply focus on outlining the institutional and technological conditions that are in place today that enable the acceleration of currency multipolarity. This section also explores some of the potential challenges to the evolution towards currency multipolarity.
Existing Infrastructure
In terms of infrastructure to support non-USD settlements, there are already a number of key elements that make it possible. There are alternative payment systems including the Cross-Border Interbank Payment System (CIPS), China’s alternative to SWIFT, which facilitates yuan-denominated trade. Russia and India also operate their own bank-to-bank messaging systems. Russia’s SPFS (System for Transfer of Financial Messages) is being used, connecting banks in Russia and several other countries while India’s UPI (Unified Payments Interface), developed primarily for domestic uses, has the potential to expand for cross-border use.
At the same time, BRICS collectively is progressing work on BRICS Clear, an alternative payments platform for member states. It is likely that BRICS Clear will be revealed as a functional proof of concept during 2025.
Bilateral currency swap agreements also support non-USD payments clearances. Many countries have already established bilateral currency swap agreements to facilitate trade in their own currencies. For example, China has swap agreements with over 40 countries, including many in ASEAN and Africa and India has signed rupee trade agreements with countries like the UAE and Russia. These agreements reduce the need for USD intermediation. Russia’s own experiences since early 2022, in which almost all of its external trade is now settled in non-USD and non-Euro currencies shows how quickly the move away from dollar-denominated platforms can be achieved should there be a need.
Potential Challenges and Limitations
While critical infrastructure and institutions are already in place and are being matured to support accelerated and expanded currency multipolarity, there remain a range of challenges. Perhaps the most significant of these is the lack of liquidity of a number of national currencies, making them potentially less attractive for trade settlement. Fluctuations in exchange rates can also create risks for traders, especially in small or less stable economies. Accelerating the use of national currencies requires effective coordination and consensus amongst a diverse number of nations. This can be challenging and time consuming, given differences in economic priorities and political interests. That said, a common challenge - such as comprehensive tariffs against them - could act as a galvanising catalyst to the achievement of functional coordination and agreement on critical issues that enable accelerated and expanded currency multipolarity.
The issue of complementarity and liquidity is central to dedollarisation. While complementarity ensures that trade can occur without the USD, liquidity ensures that national currencies can be used effectively for settlement. The BRICS economies are highly complementary, as discussed above, which means there are many mutually beneficial exchange pairs that can be forged and expanded amongst this group of countries. Complementarity reduces the need for a third party currency since trade can be settled directly in national currencies.
As for liquidity, the challenge is the ease with which a currency can be used for trade and investment without causing significant price fluctuations. A number of possible solutions can be developed and expanded to address liquidity challenges. These include the development and use of a non-national clearing unit of account. This is likely to be a feature of the BRICS Clear project, which could therefore provide liquidity and stability to member nations. Such a unit of account - akin to Keynes’ bancor proposition of the early 1940s - would be used by central banks to settle trade balances without relying on the U.S. dollar.
US Impacts and Adjustments
The U.S. itself will need to adjust from loss of markets and loss of supplies. Like BRICS nations, the adjustment is likely to be variable across the complex U.S. economic system.
In aggregate terms, the 100% Trump tariff could lead to a loss of ~$800 billion in imports from BRICS nations and a loss of ~$311 billion in export earnings, affecting key sectors. For example, in terms of imports, the loss of a whole raft of electronics and machinery would disrupt supply chains for consumer electronics, semiconductors, and industrial equipment. Shortages of clothing and footwear can also be expected in the short term though substitutes in low-cost producer countries are likely to be accessible. In this case, the U.S. would simply transfer its deficit in this category from one set of nations to another. More seriously, reduced supply of generic drugs and active pharmaceutical ingredients (APIs) could have a significant impact on the cost and quality of healthcare services. These will take time to replace, though it’s unlikely they can be substituted at comparable prices. An area of vulnerability for the U.S. is likely in metals and minerals where it will likely be exposed to higher costs for steel, aluminium, and rare earths.
It is reasonable to assume that the US will also adjust for many standard items within 3-5 years, but for some categories of upstream inputs, capital equipment and even some finished goods, it could take up to a decade to find alternatives. Some of this adjustment will simply see Chinese firms expand into non-tariff impacted countries, while the US will also be driven to increase imports from Germany, Republic of Korea and Japan for capital equipment, machinery and electronics.
The adjustment however is unlikely to be to a new status quo ante, but rather, is likely to settle on a higher cost plateau.
Core inflation in the U.S. could be impacted by anywhere between 3-6% without significant offsetting initiatives. Donald Trump often claims that the tariffs introduced during his first term did not lead to inflation. On aggregate terms, the annual inflation rate was around 2.1% in 2017, 2.4% in 2018 and 1.8% in 2019. At an aggregate level, Trump’s assertions are merited; however, the issue is whether tariffs impacted specific goods, namely those on which tariffs were imposed. In specific product categories, the evidence suggests that tariffs were significantly inflationary.
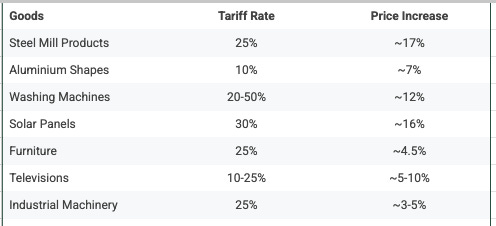
Prices of washing machines increased by as much as 12% following the imposition of tariffs in 2018, according to a study by the University of Chicago. A 25% tariff was imposed on steel and a 10% tariff on aluminium from most countries, including China, Canada, Mexico and the EU. According to the Bureau of Labor Statistics, U.S. steel prices rose significantly after tariffs were imposed, increasing ~17% from March 2018 when the tariffs were announced to July 2018. Aluminium prices also rose, though less sharply, increasing ~7% during the same period. Downstream industries that rely on steel and aluminium, such as automobiles and construction, were confronted with higher costs. Tariffs of 30% were imposed on imported solar panels in 2018. The price of solar panels increased 16% in the months following the tariffs, according to the Solar Energy Industries Association. Tariffs of 10-25% were imposed on electronics such as TVs, computers and smartphones. In 2019 prices of these goods increased between 5-10%. A 25% tariff on furniture and home goods contributed to furniture prices increasing 4.5% in 2019, according to the Bureau of Labor Statistics, while the tariffs on machinery and equipment used in manufacturing contributed to price increases of between 3-5% in 2019 according to various industry reports.
The effect of tariffs on specific product categories was variable, as can be seen, but clearly without any other systemic offsets contributed to price increases at rates above the general rate of inflation.
Table 4: Summary of Price Changes and Tariffs (2018-2019)
As for the future, the Petersen Institute for International Economics estimates that a 100% on all imports could reduce U.S. GDP by 1-2% over several years, and possibly exacerbate the U.S. trade deficit rather than alleviate it.
Should the proposed 100% tariffs contribute to renewed inflationary pressures, the risk is that the poorest in the US community will be hardest hit. Retirees and fixed income earners will also be impacted by rising healthcare, drugs and utilities costs. Income inequality will worsen. Those promised that the American Dream will be restored are likely to be disappointed, again.
In the face of rising inflation, the Fed will be tempted to increase interest rates, right or wrong. The effect will be distributional as well as having implications for Trump’s capital formation ambitions. Those holding interest-bearing assets will see income growth; those holding interest-bearing liabilities will face further pressure on constrained budgets.

A Renaissance of American Manufacturing?
As for the ambitions of tariffs catalysing the rejuvenation of American manufacturing, there are likely to be considerable barriers to the realisation of this hope.
For starters, the US would need to dramatically increase imports of capital goods, robotics, machinery and other equipment if it is to enable the expansion of domestic manufacturing output. Having imposed tariffs on BRICS countries, the US is likely to have to import these goods from Germany and Japan, in the main. It may also end up increasing imports from Chinese firms that have set up facilities in non-tariff impacted jurisdictions. Either way U.S. importers will confront relatively higher costs than would have been the case otherwise. In effect, the US shifts its trade deficits around without necessarily fundamentally changing the productive structure of its domestic economy in the short term. This has been evident since the imposition of tariffs by the first Trump administration.The evidence of the effects of Trump’s first term tariffs and subsequent doubling down by the Biden administration also indicates that there has been no discernible return of manufacturing jobs to the ‘heartland’, as demonstrated in work undertaken by David Autor and colleagues in early 2024.
Additionally, modern manufacturing is not only capital intensive it also demands a workforce that is highly educated. A numerate and literate workforce is a condition precedent of a viable manufacturing ecosystem. In this environment, the US would firstly need to overcome low relative literacy and numeracy rates in its population or rely on highly skilled migrants. In the short term, a political culture that has lambasted an educated elite in favour of promoting pride in ignorance in the name of “common sense”, may win votes but doesn’t support industrial rejuvenation. An education system that lumbers graduates with growing student debts also acts as a barrier to education for people from lower income households. It is little wonder that social mobility in the U.S. today is worse than it was a century ago.
Lastly, a political economy that is heavily tilted in favour of the financialised sectors of finance, real estate, insurance and the like has been a cause of industrial decline for over 5 decades. Without addressing this structural feature, access to and ability to mobilise the necessary money capital - be it in equity or debt form - to expand manufacturing will be extremely challenging. Relatively high interest rates - ostensibly to address inflationary pressures - would dampen capital formation in manufacturing, as money capital continues to find its way into the markets for fictitious capital.

Implications on USD
Globally, demand for US dollars is likely to reduce, because of reduced need for USD for trade settlements. This has flow-on implications for US credit rating, living standards and ultimately US dollar-driven political and economic power.
Meanwhile, the global system in which the US has exchanged IOUs - that is, US dollars - for real economic resources is becoming less and less appealing to those with the resources, the knowhow and the technologies to transform them. This is even more the case when these IOUs are increasingly weaponised. The threat of tariffs is doubtless disruptive, but there is a real possibility that they will hasten the demise of US dollar hegemony and consolidate the evolution towards a multipolar trading environment.
That said, the annual global value of trade in real goods and services is dwarfed by the volume of transaction value, denominated in U.S. dollars, in what can be called the markets of fictitious capital. Fictitious capital refers to financial assets whose value is derived from claims on future income or capital gains, rather than tangible goods or services. These markets include:
Stock Markets
Bond Markets
Derivatives Markets
Foreign Exchange (Forex) Markets
Commodities Markets (financialised portion)
Table 5 summarises the estimated value of trading volume in these markets, denominated in USD. It shows that these markets are over 100 times larger than the total value of global trade in real goods and services.
Table 5: Total Value of Transactions in Fictitious Capital Markets (USD-Denominated)
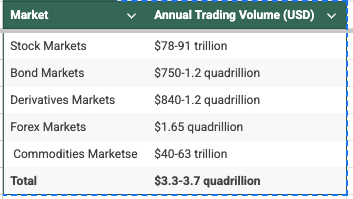
It is clear that the vast majority of USD liquidity is tied up in financial markets rather than facilitating real trade. This highlights the dominance of speculative and investment activities over real economic transactions. It also points to the self-reinforcing effects of the USD’s historic dominance, as these markets need massive amounts of USD liquidity to function. The disproportionate size of fictitious capital markets relative to real trade increases the risk of financial instability, as shocks in these markets can have cascading effects on the global economy.
As such, reducing dependency on the USD would require not only shifting trade settlements away from the dollar but also addressing the enormous liquidity needs of financial markets. This is a much larger and more complex task than de-dollarising trade alone. However, as demand for USD for trade settlements diminishes, it also becomes clear that the disconnect between the size of USD-denominated fictitious capital markets and the real economy is significant, particularly raising doubts as to the U.S. economy’s ability to valorise (i.e., realise or justify) the value of these financial claims. This disconnect represents a vulnerability in the global financial system and raises important questions about the rationale for non-U.S. entities to accumulate USD.
As the global economy evolves, the rationale for holding USD is diminishing for many enterprises and individuals, especially when their real economic needs are not tied to the U.S. The rise of alternative payment systems, regional trade agreements, and commodity-backed trade arrangements is reducing dependency on the USD, paving the way for a more multipolar financial system. The sinews that bound much of the global economy to the USD are progressively fraying.

Concluding Remarks
Rather than be cowed by the threat of tariffs, BRICS nations may well embrace the need spurred on by them to drive home the new models of collaboration that are already in place and lock down the BRICS Clear project to mitigate future risk of dollar weaponisation. No doubt, dramatic changes to system parameters, such as 100% tariffs, are by their very nature disruptive. It is clear that there are in the short term adverse impacts on all concerned. It is therefore understandable that, all other things being equal, many would prefer to not ‘rock the boat’.
Yet, we are in a world defined by intensified flux.
While a preference for an environment with least disruption is understandable, it seems clear that should major disruptions be forced upon them, BRICS nations - and others in the wider global south - should fear nothing but fear itself. If need be, ‘go with the flow’ - be like water - and let the force of America’s tariffs fast track currency multipolarity and greater national sovereignty, while sweeping away the remaining vestiges of 500 years of colonialism and 30 years of American unipolarity.